ESDEP WG 12
FATIGUE
To summarize the main factors affecting fatigue strength, as opposed to static strength, of welded joints and to illustrate the method of carrying out a fatigue check.
Lecture 11.1.2: Introduction to Connection Design
Lecture 11.2.1: Generalities on Welded Connections
Lecture 12.12: Determination of Stress Intensity Factors
Lecture 12.13: Fracture Mechanics Applied to Fatigue
This lecture gives an explanation of the mechanism of fatigue and the influence of welding on that mechanism. It summaries the primary factors affecting fatigue strength and introduces S-N Curves. The classification of fatigue details is presented and important details reviewed. The calculation of stress range is summarised. The principal types of fatigue loading and the bases for their calculation are presented with an introduction to cycle counting and damage calculations for mixed amplitude loading.
a design weld strength parameter
Ds
R stress rangeDs
D non-propagating stress, i.e. the constant amplitude stress range below which cracks will not growN endurance number of cycles.
Fatigue is the mechanism whereby cracks grow in a structure. Growth only occurs under fluctuating stress. Final failure generally occurs in regions of tensile stress when the reduced cross-section becomes insufficient to carry the peak load without rupture. Whilst the loading on the structure is stationary the crack does not grow under normal service temperatures. Many structures, such as building frames, do not experience sufficient fluctuating stress to give rise to fatigue problems. Others do, such as bridges, cranes, and offshore structures, where the live loading is a higher proportion of the total load.
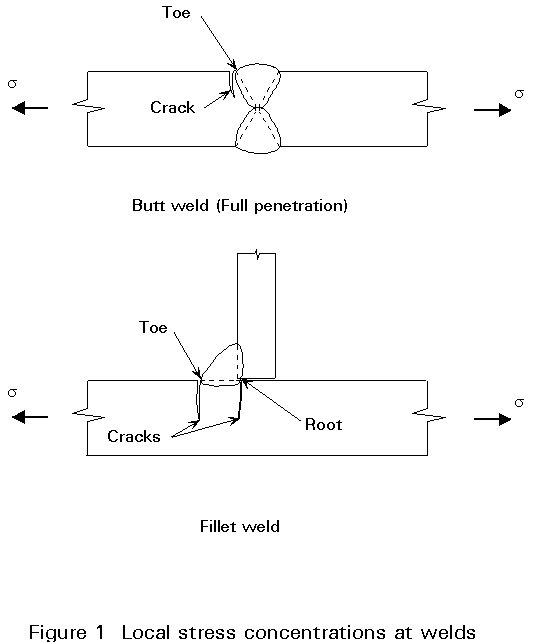
In welded steel structures, fatigue cracks will almost certainly start to grow from welds, rather than other details, because:
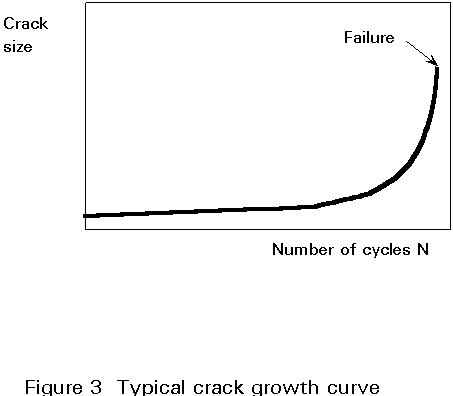
The study of fracture mechanisms shows that the growth rate of a crack is proportional to the square root of its length, given the same stress fluctuation and degree of stress concentration. For this reason fatigue cracks spend most of their life as very small cracks which are hard to detect. Only in the last stages of life does the crack start to cause a significant loss of cross-section area, as shown in Figure 3. This behaviour poses problems for in-service inspection of structures.
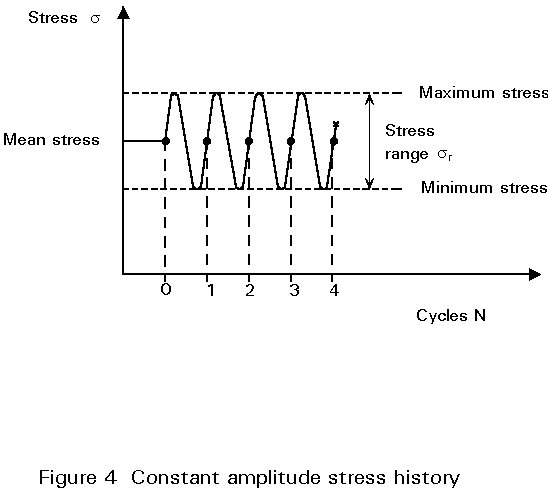
The fatigue strength of a welded component is defined as the stress range (DsR) which fluctuating at constant amplitude, causes failure of the component after a specified number of cycles (N). The stress range is the difference between the maximum and minimum points in the cycle, see Figure 4. The number of cycles to failure is known as the endurance or fatigue life.
For practical design purposes there are two main factors which affect the fatigue life of a detail, namely:
The fatigue life (N), or endurance, in number of cycles to failure can be calculated from the expression:
N = a/DsRm (1)
or
log N = log d - m log DsR (2)
where m is a constant, which for most welded details is equal to 3. Predictions of life are therefore particularly sensitive to accuracy of stress prediction.
The expression linking N and DsRm can be plotted on a logarithmic scale as a straight line, Equation (2), and is referred to as an S-N curve. An example is shown in Figure 5. The relationship holds for a wide range of endurance. It is limited at the low endurance end by static failure when the ultimate material strength is exceeded. At endurances exceeding about 5-10 million cycles the stress ranges are generally too small to permit propagation under constant amplitude loading. This limit is called the non-propagating stress (DsD). Below this stress range cracks will not grow.
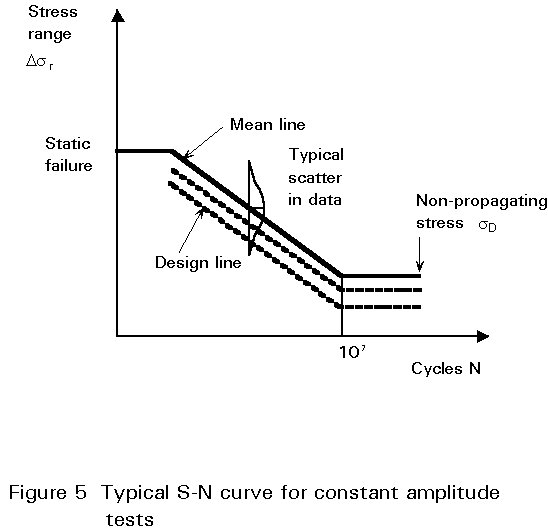
For design purposes it is usual to use design S-N curves which give fatigue strengths about 25% below the mean failure values, as shown in Figure 5. 'a' is used to define these lines.
In non-welded details the endurance is reduced as the mean stress becomes more tensile. In welded details the endurance is not usually reduced in those circumstances. This behaviour occurs because the weld shrinkage stresses (or residual stresses), which are locked into the weld regions at fabrication, often attain tensile yield. The crack cannot distinguish between applied and residual stress. Thus, for the purposes of design, the S-N curve always assumes the worst, i.e. that the maximum stress in the cycle is at yield point in tension. It is particularly important to appreciate this point as it means that fatigue cracks can grow in parts of members which are nominally 'in compression'.
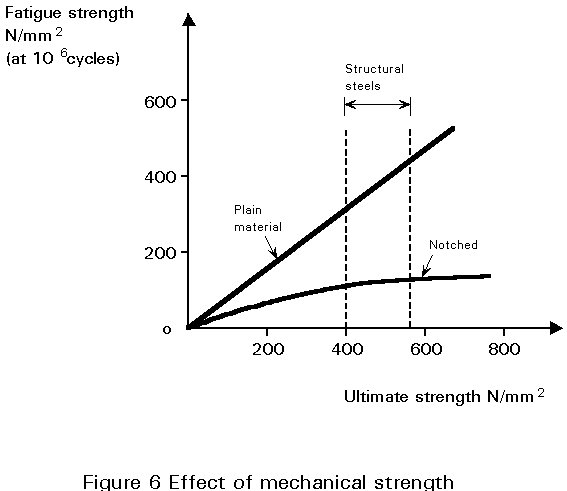
The rate of crack growth is not significantly affected by variations in proof stress or ultimate tensile strength within the range of low alloy steels used for general structural purposes. These properties only affect the initiation period, which, being negligible in welds, results in little influence on fatigue life. This behaviour contrasts with the fatigue of non-welded details where increased mechanical strength generally results in improved fatigue strength, as shown in Figure 6.
The fatigue strength parameter (K2) of different welded details varies according to the severity of the stress concentration effect. As there are a wide variety of detail in common use, details with similar K2 values are grouped together into a single detail class and given a single K2 value.
This data has been obtained from constant amplitude fatigue tests on simple specimens containing different welded detail types. For the most commonly used details, it has been found convenient to divide the results into fourteen main classes. The classes are:
|
Detail Category Ds c(N/mm2) |
d |
m |
|
160 |
7,962 1012 |
3 |
|
140 |
5,636 1012 |
3 |
|
125 |
3,990 1012 |
3 |
|
112 |
2,825 1012 |
3 |
|
100 |
2,000 1012 |
3 |
|
90 |
1,416 1012 |
3 |
|
80 |
1,002 1012 |
3 |
|
71 |
0,710 1012 |
3 |
|
63 |
0,502 1012 |
3 |
|
56 |
0,356 1012 |
3 |
|
50 |
0,252 1012 |
3 |
|
45 |
0,178 1012 |
3 |
|
40 |
0,126 1012 |
3 |
|
36 |
0,089 1012 |
3 |
As shown in Figure 7, these classes can be plotted as a family of S-N curves. The difference in stress range between neighbouring curves is usually between 15 and 20%.
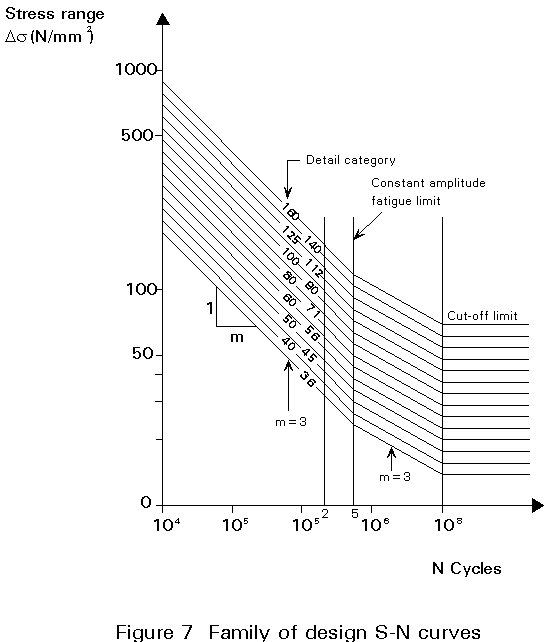
The above table has been taken from Eurocode 3 [1]. It does not include S-N data for unstiffened hollow tubular joints.
There are usually a number of detail types within each class. Each type has a very specific description which defines the geometry both microscopically and macroscopically. The main features that affect the detail type, and hence its classification, are:
e.g. plate, rolled section, reinforcing bar.
The location must be defined with respect to the direction of stress fluctuation. A given structural joint may contain more than one potential initiation site, in which case the joint may fall into two or more detail types.
e.g. weld shape, size of component, proximity of edges, abruptness of change of cross-section.
e.g. type of weld process, any grinding smooth of particular parts of the joint.
Special inspection procedures may be required on higher class details to ensure that detrimental welding defects are not present.
It should be noted that if fatigue is critical in the design, the extra controls on fabrication incurred by the last two requirements may increase the total cost significantly above that for purely static strength.
Examples of different types of welded detail and their classes are shown in Eurocode 3: Part 1.1 [1].
Figure 8 shows some of the most important details to look out for in welded steelwork.
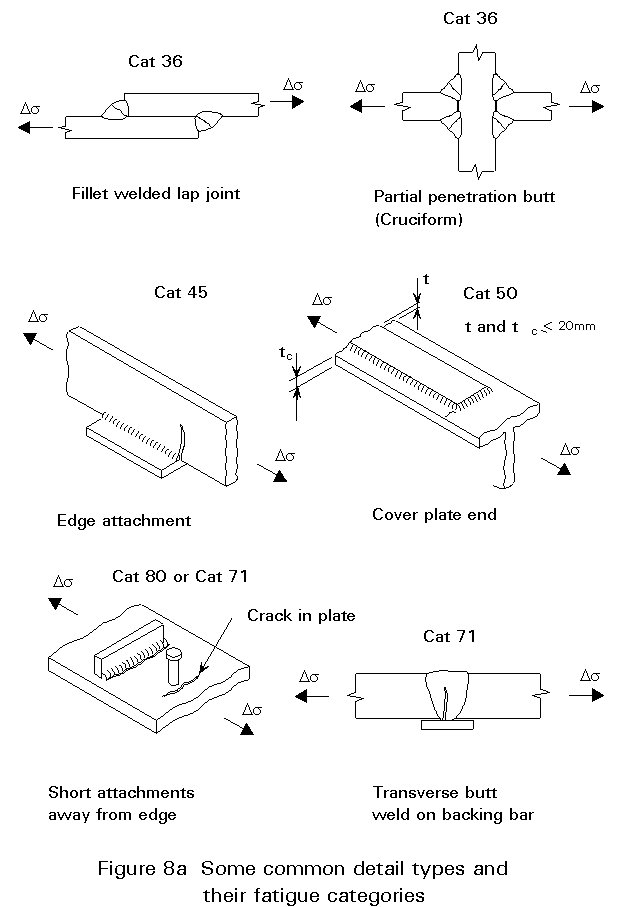
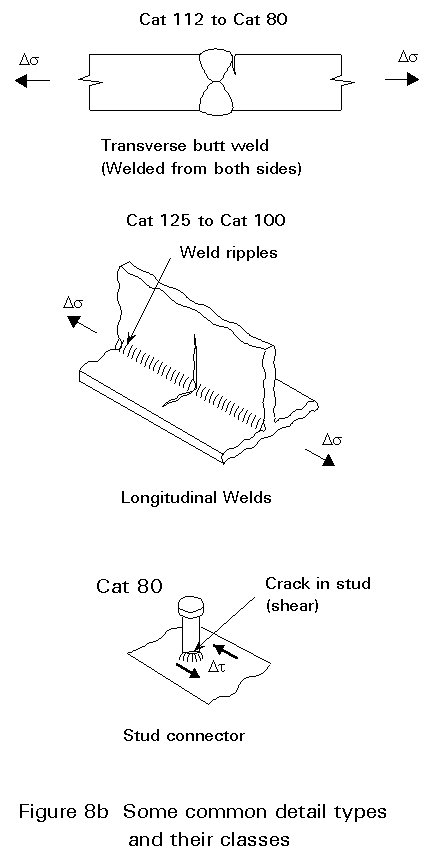
They are:
It should be borne in mind that most potential fatigue sites on welded structures are found to be category 80 or below.
The stress areas are essentially similar to those used for static design. For a crack starting at a weld toe, the cross-section of the member through which propagation occurs is used. For a crack starting at the root, and propagating through the weld throat, the minimum throat area is used, as shown in Figure 8a.
The force fluctuation in the structure must be calculated elastically. No plastic redistribution is permitted.
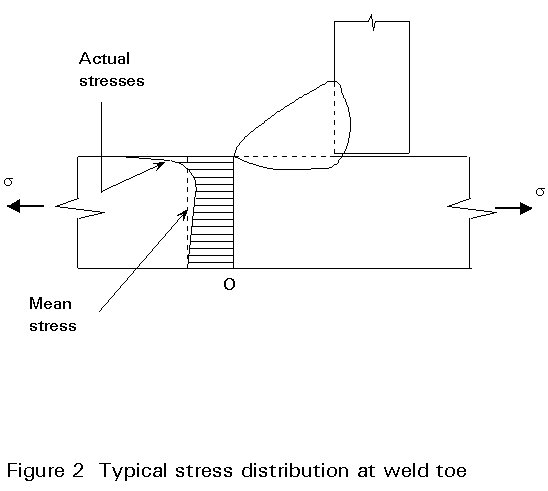
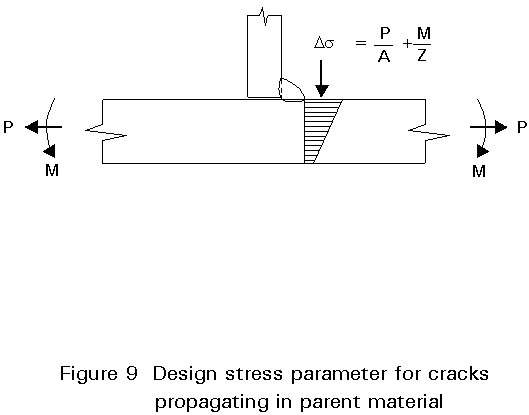
The stress on the critical cross-section is the principal stress at the position of the weld toe (in the case of weld toes cracks). Simple elastic theory is used assuming plane sections remain plane, see Figure 9. The effect of the local stress concentration caused by the weld profile is ignored as this is already catered for by the parameter 'd' which determines the weld class.
In the case of throat failures, the vector sum of the stresses on the weld throat at the position of highest vector stress along the weld is used, as in static design.
Exceptions to these rules occur in the case of unstiffened joints between slender members such as tubes. In this case the stress parameter is the Hot Spot Stress. This stress is calculated at the point of expected crack initiation, taking into account the true elastic deformation in the joint, i.e. not assuming plane sections to remain plane.
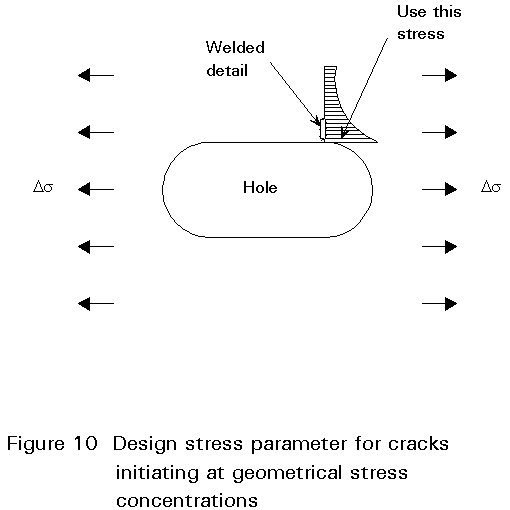
Where a member has large changes in cross-section, e.g. at access holes, there will be regions of stress concentration due to the change of geometry. In static design the stresses are based on the net area as plastic redistribution will normally reduce these peaks at ultimate load. With fatigue this is not so, and if there is a welded detail in the area of the geometrical stress raiser the true stress must be used, as shown in Figure 10.
Similarly any secondary effects, such as those due to joint fixity in latticed structures, and shear lag and other distortional effects in slender beams, are allowed for in calculating the stresses.
Examples of structures and the loads which can cause fatigue are:
Bridges: Commercial vehicles, goods trains
Cranes: Lifting, rolling and inertial loads
Offshore structures: Waves
Slender chimneys: Wind gusting
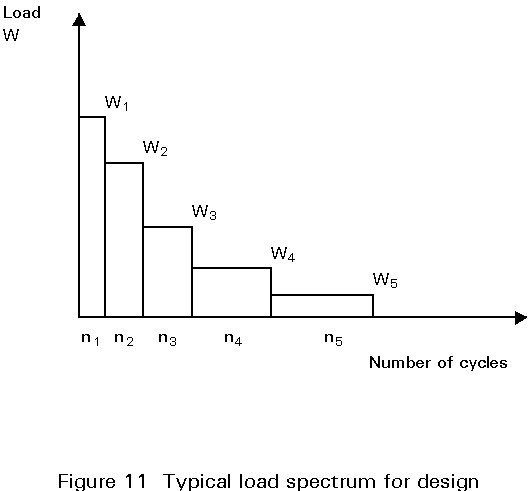
The designer's objective is to anticipate the sequence of service loading throughout the structure's life. The magnitude of the peak load, which is vital for static design purposes, is generally of little concern as it only represents one cycle in millions. For example, highway bridge girders may experience 100 million significant cycles in their lifetime. The sequence is important because it affects the stress range, particularly if the structure is loaded by more than one independent load system.
For convenience, loadings are usually simplified into a load spectrum, which defines a series of bands of constant load levels, and the number of times that each band is experienced, as shown in Figure 11.
Slender structures, with natural frequencies low enough to respond to the loading frequency, may suffer dynamic magnification of stress. This magnification can shorten the life considerably.
A useful source of information on fatigue loading is Eurocode 1 [2].
In practice most stress histories in real structures are of the variable amplitude type, shown in Figure 12, as opposed to the constant amplitude shown in Figure 4. Such histories pose a problem in defining the number and amplitude of the cycles.
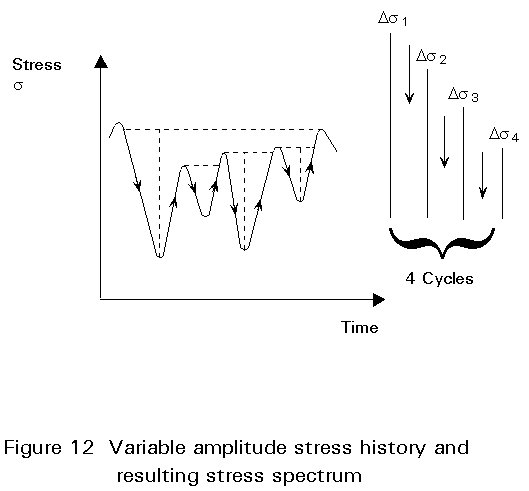
The first step is to break the sequence into a stress spectrum as shown in Figure 12 using a cycle counting method. There are various methods in use. The two most used are the Rainflow Method and the Reservoir Method. The latter, which is easy to use by hand for short stress histories, is described in Lecture 12.2. The former is more convenient for analysing long stress histories using a computer.
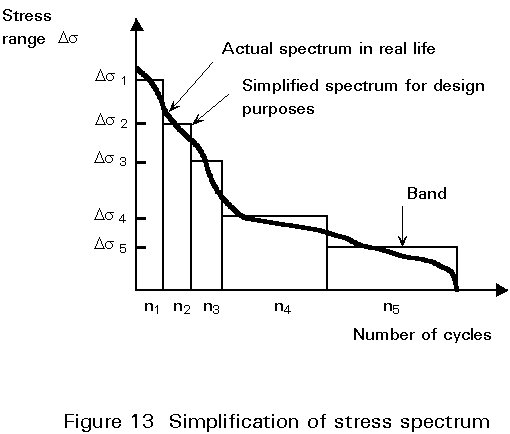
Under variable amplitude loading the life is estimated by calculation of the total damage done by each cycle in the stress spectrum. In practice the spectrum is simplified into a manageable number of bands, as shown in Figure 13.
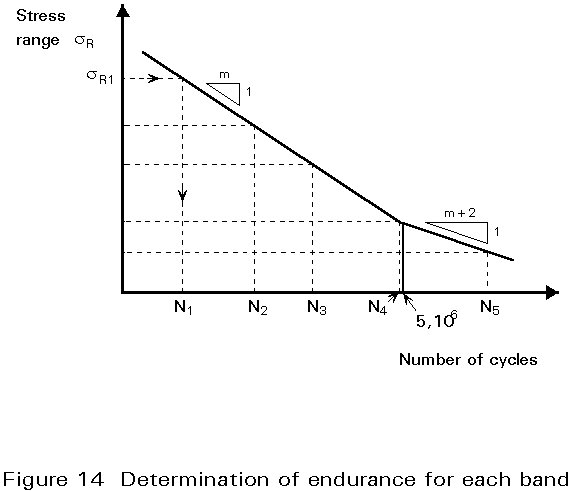
The damage done by each band in the spectrum is defined as ![]() where n is the required number of cycles in the band during the design life and N is the endurance under that stress range, see Figure 14.
where n is the required number of cycles in the band during the design life and N is the endurance under that stress range, see Figure 14.
If failure is to be prevented before the end of the specified design life, the Palmgren-Miner's Rule must be compiled with. This rule states that the damage done by all bands together must not exceed unity, i.e.:
![]()
It should be noted that, when variable amplitude loading occurs, the bands in the spectrum with Ds values less than DsD may still cause damage. Damage occurs because the larger amplitude cycles may start to propagate the crack. Once it starts to grow lower cycles become effective. In this case, the horizontal constant amplitude fatigue limit DsD shown in Figure 5, is replaced by a sloping line with a log gradient of ![]() .
.
- Fatigue depends on the whole service loading sequence (not one extreme load event).
- Fatigue of welds is not improved by better mechanical properties.
- Fatigue is very sensitive to the geometry of details.
- Fatigue requires more accurate prediction of elastic stress.
- Fatigue makes more demands on workmanship and inspection.
[1] Eurocode 3: "Design of Steel Structures": ENV1993-1-1: Part 1.1: General Rules and Rules for Buildings, CEN 1992.
[2] Eurocode 1: "Basis of Design and Actions on Structures", CEN (in preparation).