ESDEP WG 12
FATIGUE
To show methods for the practical application of fracture mechanics for predictions of fatigue crack growth through to final failure including estimates of the significance of flaws.
Lecture 12.10: Basics of Fracture Mechanics
Lecture 12.11: Stress Analysis of Cracked Bodies
Lecture 12.12: Determination of Stress Intensity Factors
Lecture 12.13: Fracture Mechanics Applied to Fatigue
Lecture 12.1: Basic Introduction to Fatigue
Lecture 12.2: Advanced Introduction to Fatigue
Lecture 12.8: Basic Design Concepts in Eurocode 3
The lecture describes the application of fracture mechanics procedures for estimating crack shape development and fatigue lives by considering incremental crack growth at the deepest point and surface points of a crack. The effect of multiple initiation sites and the subsequent coalescence is described. The failure assessment diagram method for determining final failure by fracture or plastic collapse is explained. The extension of the fatigue treatments to variable amplitude loading and to include residual stress, threshold, and crack closure effects is described.
The general background to the use of fracture mechanics for fatigue applications is described in Lecture 12.13. This background showed that the Paris Law for instantaneous growth rate of fatigue crack propagation could be integrated to determine the fatigue life between given initial and final crack sizes. It was also shown that this approach is entirely consistent with the S-N approach for welded details, and leads to relationships of the form SmN = constant, where m is the crack growth exponent in the Paris Law, which typically has a value of about 3. For variable amplitude loading it was also shown that the fracture mechanics approach gave the same answers as Miner's Law for variable amplitude loading on the assumption that there is no interaction between cycles of different stress levels.
Cracks can be categorised in geometrical terms as:
(i) through-thickness cracks
(ii) embedded cracks
(iii) surface cracks
For the purpose of modelling the fracture mechanics, the part-thickness embedded or surface cracks are idealised as elliptical or semi-elliptical in shape. Most fatigue cracks in welded structures start either from surface stress concentrations such as weld toes, or from weld discontinuities or internal flaws. Thus fatigue cracks grow from an initial part-thickness condition to through-thickness and then grow on as through-thickness cracks if they have not reached final failure.
During the stages at which a fatigue crack is part-thickness, the stress intensity factor varies around the perimeter of the crack front, as described in Lectures 12.10 and
12.11. Since the crack growth rate depends on the stress intensity factor raised to the power m, it follows that the crack grows at different rates at different positions around the crack front and may therefore change its shape progressively. The Y factor in the general expression for the stress intensity factor, K = Y ![]() , is itself a function of both a/T, the crack depth to thickness ratio, and a/2c, the crack depth to crack length or aspect ratio for part thickness cracks. It is therefore no longer possible to integrate the Paris Law equation directly as an analytical expression because of the changes in Y as the crack grows and changes the a/T and a/2c ratios.
, is itself a function of both a/T, the crack depth to thickness ratio, and a/2c, the crack depth to crack length or aspect ratio for part thickness cracks. It is therefore no longer possible to integrate the Paris Law equation directly as an analytical expression because of the changes in Y as the crack grows and changes the a/T and a/2c ratios.
The procedure adopted to deal with this situation is to use incremental numerical methods. Starting with the required initial crack depth and aspect ratio, the stress intensity factor is calculated at the deepest point of the crack and at the ends of the crack for the stressing conditions applied. This can be done using the parametric equations of Raju and Newman, included for example also in BSI Document PD 6493 [1], for either pure tension or pure bending stress conditions in a flat plate. It can be shown that conservative (high) estimates of the stress intensity factor are always obtained if the applied stress field is represented by a linear gradient of tension and bending stress over the region of the crack.
The Raju and Newman equations enable stress intensity factors to be calculated for unit stresses in tension or bending at any position around the crack front, and the total stress intensity factor can be calculated by adding together the separate tension and bending components corresponding to the stress field considered. To determine the progressive change in crack shape, the procedure is firstly to calculate the stress intensity factor for the deepest and surface (end) positions on the crack front. The crack growth rate is then calculated at the deepest and incremental distance in the deepest direction. This distance should be chosen as a small proportion of the remaining ligament such that the crack growth rate can be considered sensibly constant, and the number of cycles is the distance divided by the growth rate. This same number of cycles is then applied to the growth rate at the ends of the crack to calculate the increment of crack growth in this direction. Adding the increments of crack growth in each direction to the original crack dimensions gives the new dimensions which determine the new shape.
The stress intensity factors at the deepest and end positions are then recalculated for the new crack dimensions and the procedure repeated for a new increment of crack growth in the depth direction. This calculation is repeated again and again until the crack reaches a pre-determined final size or reaches a size to cause failure. The choice of size of increments of crack growth in the depth direction is important in determining both accuracy and time/cost of carrying out the analysis. The analysis is usually put into effect by writing a computer program to implement the step by step calculations. The smaller the increments the more accurate the results but the more steps are required to reach a given final crack size. The most efficient procedure is generally found to be to use small increments from the initial crack size and increase these in steps on a logarithmic basis over the remaining ligament of the thickness. The reason for this procedure is that, as the crack grows larger, the growth rate increases substantially because the stress intensity factor is raised to a power in the crack growth law. Thus most of the fatigue life is spent whilst the crack is small and the crack growth rate accelerates to failure rapidly.
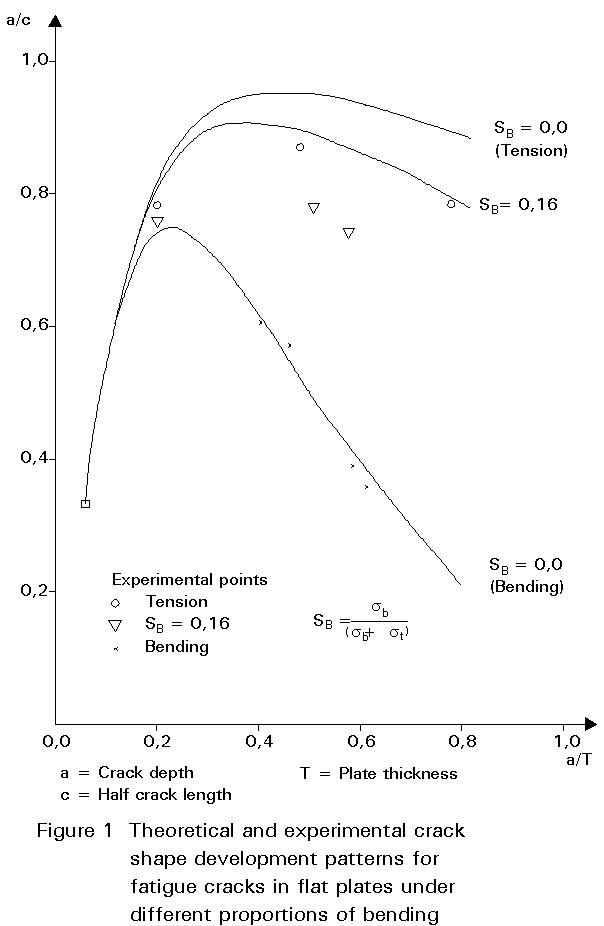
Because tension and bending stresses produce different ratios of the stress intensity factor at the deepest and end positions of the crack, different crack shapes are produced for these conditions. The fatigue crack tends to grow to a shape in which the stress intensity factor is uniform around the crack front. For tension loading the stable crack shape tends towards semi-circular, whilst for pure bending applied loads the stable shape is semi-elliptical. This is shown in Figure 1 where results of fracture mechanics analyses are compared with experiment in some work at UMIST by Chu [2]. There can be some effects of variable amplitude loading and threshold on crack shape development. These effects are discussed later.
The initial crack dimensions to be used in a fatigue fracture mechanics analysis depend on the level of detailed accuracy of model used. Where assessment is being carried out of a known detected flaw, clearly the dimensions of that flaw should be used. If an attempt is being made to model the behaviour of notionally sound welds then consideration has to be given to the imperfections and stress fields inherent to welded joints. The assumptions made in this respect can make significant differences to the predicted results obtained. It is now well established that virtually the whole of the fatigue life of as-welded joints is taken up with propagation of initial tiny flaws to a final crack size for failure. It is necessary for the fracture mechanics models to represent observed experimental behaviour both in respect of fatigue life to failure and crack shape development. The models which do this best involve multiple crack initiation and coalescence as discussed below.
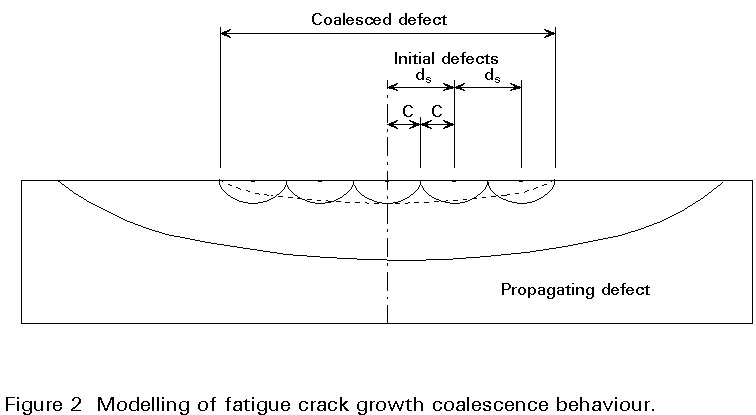
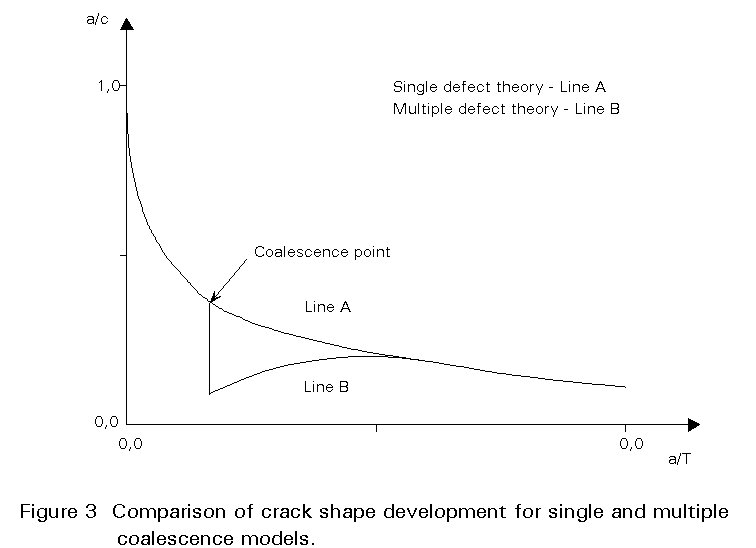
In welded structures it is commonly found that fatigue cracks initiate from tiny slag intrusions in the partially melted region at the weld toe alongside the fusion line. These intrusions are distributed randomly along the weld toe region. This distribution leads to multiple independent initiation of a series of small fatigue cracks at the weld toe. The precise positions at which these cracks are initiated depends both on the occurrence of these intrusions and on the detail of weld toe geometry such as weld toe radius, weld size and weld angle. The cracks grow independently until they interact with adjacent similar cracks. At this stage they coalesce to form a single crack of the same depth as the individual single cracks but with a length covering the combined length of all the cracks which have come together as shown in Figure 2. The effect is that the crack shape development curve shows a discontinuity when coalescence occurs. This discontinuity is shown in Figure 3 for the case of a fracture mechanics analysis of crack shape development in the stress fields typical of offshore tubular joints. A comparison is also made in Figure 3 with the case of a single crack of the same initial shape. A study of these effects by Thurlbeck [3] at UMIST showed that the coalescence stage depended on the size, aspect ratio and pitch of the initial weld toe intrusions, and that the fracture mechanics analysis could give a good prediction of observed experimental behaviour provided the weld toe geometry, and variable amplitude loading/threshold effects are taken into account.
The sizes of weld toe intrusions to be taken as initial cracks in the fracture mechanics analyses of fatigue in welded joints are of the order of 0,1 to 0,4mm depth. For the multiple crack growth case, the initial aspect ratio is taken as a typical a/2c ratio of 1, i.e. semi-circular. The initial spacing of these intrusions depends on welding procedure, plate thickness and stress level, but is typically of the order of 10 to 20mm.
In variable amplitude loading it is possible for the stress intensity factor at, say, the surface (end) position of the crack to be above the threshold, whilst at the deepest position the stress intensity factor may be below the threshold, particularly under bending stress conditions applied to a weld toe region. If this situation occurs, crack growth can take place at the ends of the crack but not at the deepest point for this load level. The fracture mechanics crack growth procedure must take account of this behaviour. Thus the crack will change its shape in a different way from that which would occur without threshold effects intervening. This effect tends sometimes to drive cracks along the surface to give them a longer aspect ratio under variable amplitude than for constant amplitude, but the effects can be predicted by a carefully set up fracture mechanics model.
The final crack size to be used as the upper limit for the fracture mechanics analysis is usually taken as either equal to the plate thickness or to the crack size which would cause an unacceptable risk of failure. The failure modes usually considered are fracture or plastic collapse. Fracture mechanics analyses are also used to determine these conditions and can be built into an overall computer program calculating both fatigue and final failure behaviour. In components containing liquids or gases, the development of through-thickness cracking clearly represents failure by leakage, and this crack size represents a natural upper limit for such cases.
In the introductory Lecture 12.10 on fracture mechanics, the basis of the stress intensity factor as the parameter controlling stress, strain, and energy fields in the neighbourhood of a crack tip was explained, and methods of determining it were described in Lecture 12.12. It was also explained that in materials which fail by fracture under linear elastic conditions the failure occurs at a critical value of the stress intensity factor. This critical value is known as the fracture toughness and given the symbol Kc. It is found that this fracture toughness depends on the material, temperature, strain rate, and triaxiality of stress. This latter effect is usually manifested by effects of geometry and thickness on the toughness values measured experimentally. The toughness is found to be lower for thicker material. In standard bend or compact tension specimens a minimum thickness requirement is given to ensure that plane strain conditions are maintained throughout to obtain a minimum toughness level known as the plane strain fracture toughness and given the symbol Klc. It was also explained in Lecture 12.10 that local yielding at the crack tip had the same effect as a slight increase in crack length for elastic cases and the concept of a plastic zone correction for the stress intensity factor was introduced. This effect of plasticity in increasing the severity of crack tip conditions becomes more important as applied stress conditions approach general yielding. The stress intensity factor loses its validity as a linear elastic parameter, at least in small scale laboratory specimens, although in full scale structures it is still possible to have a large absolute size of plastic region contained by surrounding elastic material. To analyse such situations properly it is necessary to carry out elastic-plastic stress analyses of cracked bodies and to use alternative parameters to measure the severity of crack tip conditions. Two such parameters are the crack (tip) opening displacement d, and the J contour integral. A full discussion of these parameters is beyond the scope of the present lecture, but it is sufficient to know that both of these parameters are commonly turned into equivalent notional stress intensity factor or fracture toughness values in terms of K through the following relationships:
![]() K2
= Ef J = Ef msyd
(1)
K2
= Ef J = Ef msyd
(1)
where Ef = E for plane stress, and Ef = E/(1- n2) for plane strain, and m is a constraint factor lying between 1 and 2.
As well as failure by fracture including the effects of yielding on severity of crack tip conditions, the effect of cracks on failure by plastic collapse on the remaining net cross-section has to be considered. One of the best methods of combining together consideration of fracture and plastic collapse is the use of failure assessment diagrams of the type developed originally in the UK by the CEGB as their R6 approach, and now also included in PD 6493 [1] which describes assessment of the significance of weld defects. An example of a level 2 assessment diagram is shown in Figure 4. The vertical axis can be thought of as the fracture axis, and is the ratio of the applied elastic stress intensity factor to the plane strain fracture toughness, Kr. Clearly, if this ratio reaches 1, then failure occurs by fracture. The horizontal axis can be thought of as the plasticity axis, and is the ratio of the applied load to the plastic collapse load, Sr (based on collapse at the flow strength, the average of yield and ultimate strengths). Again, if this ratio reaches 1, failure is predicted, this time by plastic collapse. As the Sr ratio increases so does the amount of plasticity at the crack tip, which in turn increases the severity of crack tip conditions from a fracture point of view. If the equivalent stress intensity factor of Equation (1) is thought of as consisting of elastic and plastic parts, as the amount of plasticity increases so the plastic part of the equivalent stress intensity factor must increase and the elastic proportion must reduce. Since the Kr axis uses only the elastic stress intensity factor, the effect of plasticity has to be taken into account by a reducing value of Kr as Sr increases. Thus, in Figure 4, the height of the assessment diagram curve at any value of Sr represents the permitted value of Kr based on elastic stress intensity factor, whilst the shaded area above the curve represents the additional contribution to the equivalent stress intensity factor due to plasticity.
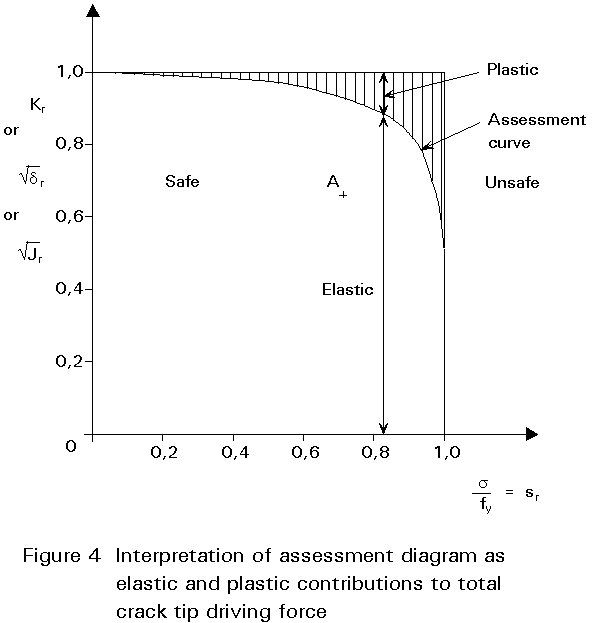
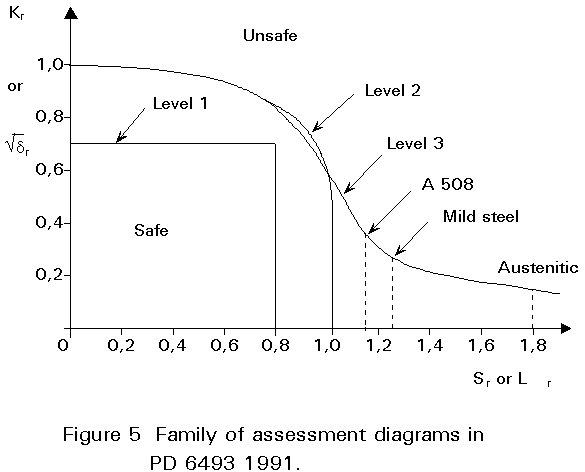
The procedure for assessing the acceptability of any given crack size is to calculate the parameters Kr and Sr (or Lr for the level 3 assessment diagram based on yield and strain hardening behaviour). In the 1991 edition of the BSI document PD 6493 [1] there are three levels of assessment diagram as shown in Figure 5 and detailed procedures are given for calculating the different parameters. The point representing the coordinates Kr Sr (or Lr) is plotted on the appropriate assessment diagram. If this point lies inside the assessment diagram as shown at A on Figure 4 the crack is considered safe, whereas if it lies outside the curve as shown at B the crack is considered unsafe.
It should be noted that, for fracture assessment purposes, the stress intensity factor must be calculated based on the maximum value of the applied stress and must also include the effect of any residual, thermal, or other secondary stresses. For fatigue crack growth calculations, it is the range of stress intensity factor which must be used in Paris Law relationships and welding residual stresses do not come into this directly although they may have indirect effects as discussed below.
When computer programs are used to calculate fatigue crack growth behaviour, the same program can be used to calculate the parameters Kr and Sr (or Lr) at the end of each increment of crack growth and check whether the values are acceptable for the assessment diagram concerned.
Mention has been made in other lectures of crack closure, threshold and effective stress intensity factors. There is considerable evidence to show that two of the effects of plasticity are to make the crack tip propagate through stretched material and to create a wake of unloaded plastic material behind the advancing crack tip. The effect of this behaviour is that the crack faces may close together, and only that part of the stress intensity factor range that is damaging for fatigue crack propagation is that due to stresses above the level at which the crack faces separate again. A number of research workers have developed computer programs for fatigue crack propagation based on use of effective stress intensity factor ranges, taking into account the effects of stress ratio and residual stresses on crack closure behaviour, including stress cycle interaction effects in variable amplitude loading. These treatments show considerable promise in predicting the effects of these different variables on fatigue crack behaviour but detailed consideration is beyond the scope of these lectures.
[1] PD6493: Guidance on Methods for Assessing the Acceptability of Flaws in Fusion Welded Structures, British Standards Institution, 1991.
[2] Chu, W. H., The Influence of Plate Thickness Geometry Variations on Fatigue Strength of Fillet Welded Joints, MSc Thesis, UMIST, 1984.
[3] Thurlbeck, S. D., A Methodology for the Assessment of Weld Toe Cracks in Tubular Offshore Joints, PhD Thesis, UMIST, 1991.