ESDEP WG 15A
STRUCTURAL SYSTEMS: OFFSHORE
To present the main analysis procedures for offshore structures.
Lecture 15A.1: Offshore Structures: General Introduction
Lecture 15A.2: Loads I: Introduction and Environmental Loads
Lecture 15A.3: Loads II: Other Loads
Lecture 15A.5: Analysis II
Analytical models used in offshore engineering are briefly described. Acceptance criteria for the verification of offshore structures are presented.
Simple rules for preliminary member sizing are given and procedures for static in-place and dynamic analysis are described.
The analysis of an offshore structure is an extensive task, embracing consideration of the different stages, i.e. execution, installation, and in-service stages, during its life. Many disciplines, e.g. structural, geotechnical, naval architecture, metallurgy are involved.
This lecture and Lecture 15A.5 are purposely limited to presenting an overview of available analysis procedures and providing benchmarks for the reader to appreciate the validity of his assumptions and results. They primarily address jackets, which are more unusual structures compared to decks and modules, and which more closely resemble onshore petro-chemical plants.
The analytical models used in offshore engineering are in some respects similar to those adopted for other types of steel structures. Only the salient features of offshore models are presented here.
The same model is used throughout the analysis process with only minor adjustments being made to suit the specific conditions, e.g. at supports in particular, relating to each analysis.
Stick models (beam elements assembled in frames) are used extensively for tubular structures (jackets, bridges, flare booms) and lattice trusses (modules, decks).
Each member is normally rigidly fixed at its ends to other elements in the model.
If more accuracy is required, particularly for the assessment of natural vibration modes, local flexibility of the connections may be represented by a joint stiffness matrix.
In addition to its geometrical and material properties, each member is characterised by hydrodynamic coefficients, e.g. relating to drag, inertia, and marine growth, to allow wave forces to be automatically generated.
Integrated decks and hulls of floating platforms involving large bulkheads are described by plate elements. The characteristics assumed for the plate elements depend on the principal state of stress which they are subjected to. Membrane stresses are taken when the element is subjected merely to axial load and shear. Plate stresses are adopted when bending and lateral pressure are to be taken into account.
The verification of an element consists of comparing its characteristic resistance(s) to a design force or stress. It includes:
An element (member or plate) is checked at typical sections (at least both ends and midspan) against resistance and buckling. This verification also includes the effect of water pressure for deepwater structures.
Tubular joints are checked against punching under various load patterns. These checks may indicate the need for local reinforcement of the chord using overthickness or internal ring-stiffeners.
Elements should also be verified against fatigue, corrosion, temperature or durability wherever relevant.
This method is presently specified by American codes (API, AISC).
The loads remain unfactored and a unique coefficient is applied to the characteristic resistance to obtain an allowable stress as follows:
|
Condition |
Axial |
Strong axis bending |
Weak axis bending |
|
Normal |
0,60 |
0,66 |
0,75 |
|
Extreme |
0,80 |
0,88 |
1,00 |
"Normal" and "Extreme" respectively represent the most severe conditions:
This method is enforced by European and Norwegian Authorities and has now been adopted by API as it offers a more uniform reliability.
Partial factors are applied to the loads and to the characteristic resistance of the element, reflecting the amount of confidence placed in the design value of each parameter and the degree of risk accepted under a limit state, i.e:
corresponds to an ultimate event considering the structural resistance with appropriate reserve.
relates to the possibility of failure under cyclic loading.
reflects the ability of the structure to resist collapse under accidental or abnormal conditions.
corresponds to criteria for normal use or durability (often specified by the plant operator).
Norwegian Authorities (2, 4) specify the following sets of load factors:
|
Limit State |
Load Categories |
||||
|
P |
L |
D |
E |
A |
|
|
ULS (normal) |
1,3 |
1,3 |
1,0 |
0,7 |
0,0 |
|
ULS (extreme) |
1,0 |
1,0 |
1,0 |
1,3 |
0,0 |
|
FLS |
0,0 |
0,0 |
0,0 |
1,0 |
0,0 |
|
PLS (accidental) |
1,0 |
1,0 |
1,0 |
1,0 |
1,0 |
|
PLS (post-damage) |
1,0 |
1,0 |
1,0 |
1,0 |
0,0 |
|
SLS |
1,0 |
1,0 |
1,0 |
1,0 |
0,0 |
where the respective load categories are:
P are permanent loads (structural weight, dry equipments, ballast, hydrostatic pressure).
L are live loads (storage, personnel, liquids).
D are deformations (out-of-level supports, subsidence).
E are environmental loads (wave, current, wind, earthquake).
A are accidental loads (dropped object, ship impact, blast, fire).
The material partial factors for steel is normally taken equal to 1,15 for ULS and 1,00 for PLS and SLS design.
Guidance for classifying typical conditions into typical limit states is given in the following table:
|
Condition |
Loadings |
Design Criterion |
|||
|
P/L |
E |
D |
A |
||
|
Construction |
P |
ULS,SLS |
|||
|
Load-Out |
P |
reduced wind |
support disp |
ULS |
|
|
Transport |
P |
transport wind and wave |
ULS |
||
|
Tow-out (accidental) |
P |
flooded compart |
PLS |
||
|
Launch |
P |
ULS |
|||
|
Lifting |
P |
ULS |
|||
|
In-Place (normal) |
P + L |
wind, wave & snow |
actual |
ULS,SLS |
|
|
In-Place (extreme) |
P + L |
wind & 100 year wave |
actual |
ULS SLS |
|
|
In-Place (exceptional) |
P + L |
wind & 10000 year wave |
actual |
PLS |
|
|
Earthquake |
P + L |
10-2 quake |
ULS |
||
|
Rare Earthquake |
P + L |
10-4 quake |
PLS |
||
|
Explosion |
P + L |
blast |
PLS |
||
|
Fire |
P + L |
fire |
PLS |
||
|
Dropped Object |
P + L |
drill collar |
PLS |
||
|
Boat Collision |
P + L |
boat impact |
PLS |
||
|
Damaged Structure |
P + reduced L |
reduced wave & wind |
PLS |
||
The analysis of a structure is an iterative process which requires progressive adjustment of the member sizes with respect to the forces they transmit, until a safe and economical design is achieved.
It is therefore of the utmost importance to start the main analysis from a model which is close to the final optimized one.
The simple rules given below provide an easy way of selecting realistic sizes for the main elements of offshore structures in moderate water depth (up to 80m) where dynamic effects are negligible.
The static in-place analysis is the basic and generally the simplest of all analyses. The structure is modelled as it stands during its operational life, and subjected to pseudo-static loads.
This analysis is always carried at the very early stage of the project, often from a simplified model, to size the main elements of the structure.
The main model should account for eccentricities and local reinforcements at the joints.
Typical models for North Sea jackets may feature over 800 nodes and 4000 members.
The contribution of appurtenances (risers, J-tubes, caissons, conductors, boat-fenders, etc.) to the overall stiffness of the structure is normally neglected.
They are therefore analysed separately and their reactions applied as loads at the interfaces with the main structure.
Since their behaviour is non-linear, foundations are often analysed separately from the structural model.
They are represented by an equivalent load-dependent secant stiffness matrix; coefficients are determined by an iterative process where the forces and displacements at the common boundaries of structural and foundation models are equated.
This matrix may need to be adjusted to the mean reaction corresponding to each loading condition.
This Section is a reminder of the main types of loads, which are described in more detail in Lectures 15A.2 and 15A.3.
Gravity loads consist of:
Depending on the area of structure under scrutiny, live loads must be positioned to produce the most severe configuration (compression or tension); this may occur for instance when positioning the drilling rig.
Environmental loads consist of wave, current and wind loads assumed to act simultaneously in the same direction.
In general eight wave incidences are selected; for each the position of the crest relative to the platform must be established such that the maximum overturning moment and/or shear are produced at the mudline.
The static in-place analysis is performed under different conditions where the loads are approximated by their pseudo-static equivalent.
The basic loads relevant to a given condition are multiplied by the appropriate load factors and combined to produce the most severe effect in each individual element of the structure.
A dynamic analysis is normally mandatory for every offshore structure, but can be restricted to the main modes in the case of stiff structures.
The dynamic model of the structure is derived from the main static model.
Some simplifications may however take place:
The governing dynamic equations of multi-degrees-of-freedom systems can be expressed in the matrix form:
MX'' + CX' + KX = P(t)
where
M is the mass matrix
C is the damping matrix
K is the stiffness matrix
X, X', X'' are the displacement, velocity and acceleration vectors (function
of time).
P(t) is the time dependent force vector; in the most general case it may depend on the displacements of the structure also (i.e. relative motion of the structure with respect to the wave velocity in Morison equation).
The mass matrix represents the distribution of masses over the structure.
Masses include that of the structure itself, the appurtenances, liquids trapped in legs or tanks, the added mass of water (mass of water displaced by the member and determined from potential flow theory) and the mass of marine growth.
Masses are generally lumped at discrete points of the model. The mass matrix consequently becomes diagonal but local modes of vibration of single members are ignored (these modes may be important for certain members subjected to an earthquake). The selection of lumping points may significantly affect the ensuing solution.
As a further simplification to larger models involving considerable degrees-of-freedom, the system can be condensed to a few freedoms while still retaining its basic energy distribution.
Damping is the most difficult to estimate among all parameters governing the dynamic response of a structure.
It may consist of structural and hydrodynamic damping.
Structural Damping
Structural damping is associated with the loss of energy by internal friction in the material.
It increases with the order of the mode, being roughly proportional to the strain energy involved in each.
Hydrodynamic Damping
Damping provided by the water surrounding the structure is commonly added to the former, but may alternatively be accounted as part of the forcing function when vibrations are close to resonance (vortex-shedding in particular).
Representation of Damping
Viscous damping represents the most common and simple form of damping. It may have one of the following representations:
All other types of non-viscous damping should preferably be expressed as an equivalent viscous damping matrix.
The stiffness matrix is in all aspects similar to the one used in static analyses.
The first step in a dynamic analysis consists of determining the principal natural vibration mode shapes and frequencies of the undamped, multi-degree-of-freedom structure up to a given order (30th to 50th).
This consists in solving the eigenvalue problem:
KX = l MX
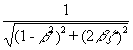
For rigid structures having a fundamental vibration period well below the range of wave periods (typically less than 3 s), the dynamic behaviour is simply accounted for by multiplying the time-dependent loads by a dynamic amplification factor (DAF):
DAF =
where b = TN/T is the ratio of the period of the structure to the wave period.
A convenient technique consists of uncoupling the equations through the normal modes of the system.
This method is only applicable if:
The total response is obtained by summing the responses of the individual single-degree-of-freedom oscillators associated to each normal mode of the structure.
This method offers the advantage that the eigen modes provide substantial insight into the problem, and can be re-used for as many subsequent response calculations as needed at later stages.
It may however prove time-consuming when a large number of modes is required to represent the response accurately. Therefore:
Such analysis is most appropriate for evaluating the steady-state response of a system subjected to cyclic loadings, as the transient part of the response vanishes rapidly under the effect of damping.
The loading function is developed in Fourier series up to an order h:
p(t) = ![]()
The plot of the amplitudes pj versus the circular frequencies wj is called the amplitude power spectra of the loading. Usually, significant values of pj only occur within a narrow range of frequencies and the analysis can be restricted to it.
The relationship between response and force vectors is expressed by the transfer matrix H, such as:
H = [-M w2 + i x C w + K]
the elements of which represent:
Hj,k = ![]()
The spectral density of response in freedom j versus force is then:
![]()
The fast Fourier transform (FFT) is the most efficient algorithm associated with this kind of analysis.
The response of the i-th mode may alternatively be determined by resorting to Duhamel's integral:
Xj(t) = ![]()
The overall response is then obtained by summing at each time step the individual responses over all significant modes.
Direct step-by-step integration of the equations of motion is the most general method and is applicable to:
The dynamic equilibrium at an instant t is governed by the same type of equations, where all matrices (mass, damping, stiffness, load) are simultaneously dependent on the time and structural response as well.
All available integration techniques are characterised by their stability (i.e. the tendency for uncontrolled divergence of amplitude to occur with increasing time steps). Unconditionally stable methods are always to be preferred (for instance Newmark-beta with b = 1/4 or Wilson-theta with q = 1,4).