ESDEP WG 2
APPLIED METALLURGY
To present the essential engineering properties of structural steels, introducing their principal metallurgical characteristics.
None
Lecture 2.1: Characteristics of Iron-Carbon Alloys
Lecture 2.2: Manufacturing and Forming Processes
This lecture provides a brief introduction to the crystalline nature of metals and the structure-sensitivity of the material properties. It explains the effect of dislocations on mechanical strength and demonstrates the use of the tensile stress/strain curve as the main means of characterizing strength. It introduces the concept of Poisson's ratio, multi-axial stress states, strain hardening and the influences of temperature and strain rate. It describes the metallurgical and mechanical means of improving strength. It introduces the concept of hardness.
Metallic bonding is a consequence of the metal atoms giving up valence electrons to a 'free electron gas'. Metallic structures at the atomic level are then envisaged as almost close-packed arrays of metal ions surrounded by the electron gas. The bonding is, in most cases, non-directional. As a consequence the common metallic crystal structures are face-centred cubic, e.g. Cu, Al, Ni, or body-centred cubic, e.g. Fe. (Some metals exist with a hexagonal close-packed structure, e.g. Zn, Cd, but these are not commonly used for structural applications.)
Metals (and alloys) with cubic structures exhibit four characteristic metallic properties, namely:
Ductility is a consequence of the lack of directionality in the bonding of the atoms and the close-packed nature of the crystal structures which normally allows profuse crystallographic slip to occur under stress. The non-directionality in the bonding also allows thermal vibrations to be readily transmitted from one vibrating atom to its neighbours, hence the high thermal conductivity. The existence of free electrons provides for high electrical conductivity. These free electrons are also responsible for metallic lustre since incident light of a wide range of wavelengths can be readily absorbed and re-radiated.
Before embarking on an examination of the properties of interest, the meaning of structure-sensitivity and structure-insensitivity, in the context of material properties, must be clarified.
Structure-insensitive properties are those which are not influenced significantly by changes in microstructure or macrostructure. It is recognised that many of the physical properties of a material, e.g. elastic modulus, bulk density, specific heat, and coefficient of thermal expansion, do not vary other than by small amounts from specimen to specimen of a given material, even if the different specimens have been subjected to very different working and/or heat treatment processes. This insensivity is present despite the fact that these processes may have produced quite substantial microstructural and macrostructural modifications. On the other hand most of the mechanical properties are very dependent on these modifications. Thus, for instance, the yield strength, ductility and fracture strength are seen to be structure-sensitive.
For an understanding of the mechanical behaviour of metals, it is necessary to consider both elastic and plastic deformation. Elastic deformation is reversible, i.e. deformation lasts only as long as load is applied. Hooke's laws connect elastic strain with stress as follows:
s = E . e
t = G . g
where
s
and e are the uniaxial stress and strain respectivelyt
and g are the shear stress and shear strain.E is the Young's modulus (210000 N/mm2)
G is the shear modulus (80000 N/mm2)
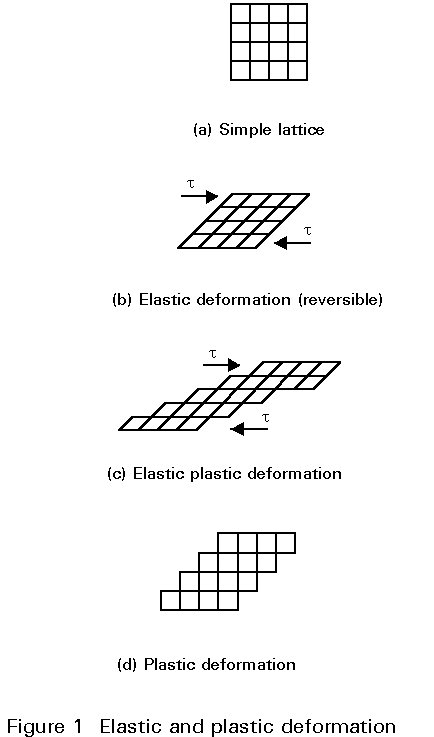
Response of a simple lattice to shear loading is shown in Figure 1. Initially the response is elastic, Figure 1(b), i.e. when the load is removed all the deformation is recovered. Beyond a limiting stress known as the yield stress, the deformation becomes elastic-plastic, Figure 1(c); when the load is removed only the elastic deformation reverses and the plastic deformation remains, Figure 1(d). This figure shows that crystallographic planes have moved against each other. Simple equations for plastic deformation (corresponding to Hooke's law for elastic deformation) do not exist.

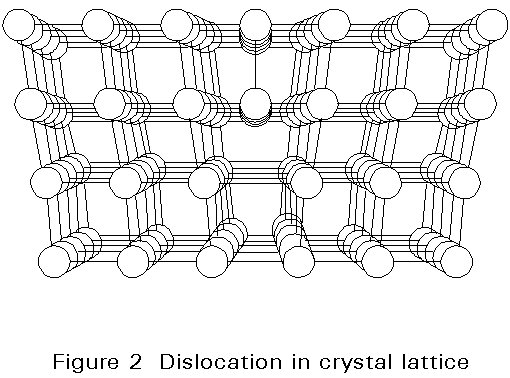
Theoretical estimates of the critical shear stress required to move a crystallographic plane one slip unit give tcrit ~ G/(2p). Measurements show that the highest strength steels attain approximately 10% of the theoretical strength. However structural steels have strengths which are two orders of magnitude less than the theoretical value. Therefore, there must be a mechanism which facilitates the slipping of crystallographic planes. This mechanism is the presence of lattice defects called dislocations. Figure 2 shows an example of a simple dislocation. During plastic deformation, a dislocation moves through the atomic lattice within the crystal, Figure 3.
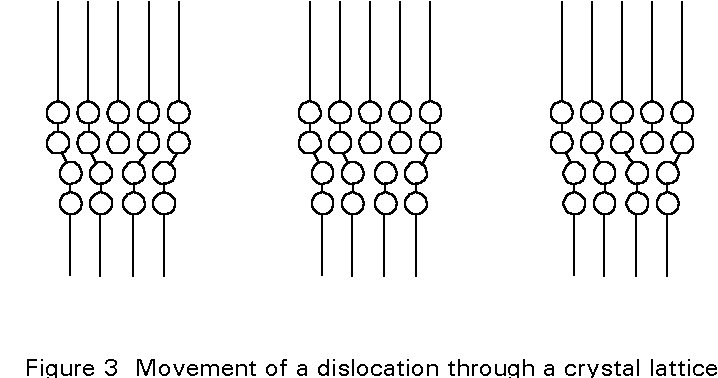
A simple analogy for dislocation motion is to consider a carpet containing a ruck. By applying a small force to the ruck, it can be moved over the length of the carpet resulting in an overall displacement of the carpet by a small increment. In the absence of the ruck, a very large force would be required to overcome the friction between the complete carpet and the floor.
Dislocations distort the surrounding lattice elastically. Some areas are compressed whilst others are stretched. These elastically deformed regions interact with other defects, i.e. with solute atoms, with other dislocations, with grain boundaries and precipitates. These obstacles impede dislocation movement making plastic deformation more difficult.
The mechanical properties of materials are determined using standardised test pieces and testing procedures. For ductile materials like most steels, tensile tests are the commonly applied testing method. Brittle materials are usually tested by bending or compression.
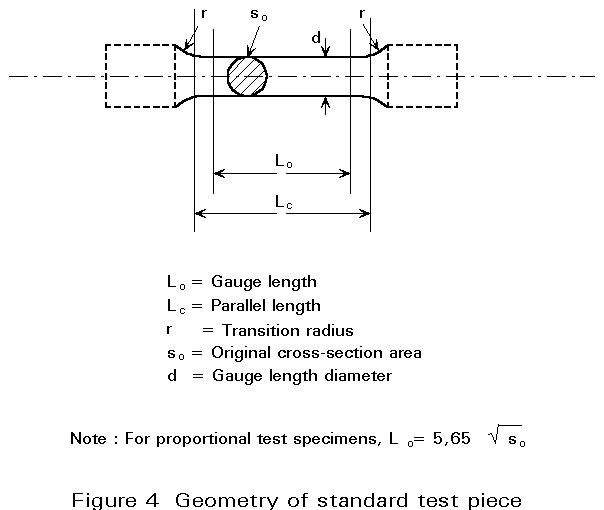
Tensile properties are usually measured using long and narrow specimens (Figure 4) which guarantee a uniaxial stress state. Round cross-sections are preferred, although rectangular specimens are employed for plate and strip and for the determination of deep drawing properties. Important parameters that have to be controlled during tensile tests are strain rate and testing temperature. The strain rate is controlled by the cross-head speed of the testing machine; the temperature can be regulated by a furnace or a cooling chamber.
Load (F) and elongation (DL) are measured during testing, from which the stress (s)-strain (e) curve can be obtained by taking the test piece dimensions into account. The nominal or engineering stress sn is the load F divided by the original cross-section area So:
s
n = F/So (1)The nominal or engineering strain en is the ratio of the change in length (L-Lo) to the original length Lo:
e
n = (L - Lo) / Lo = DL / Lo (2)Figures 5 and 6 show the stress-strain curves obtained by Equations (1) and (2) for two types of steel.
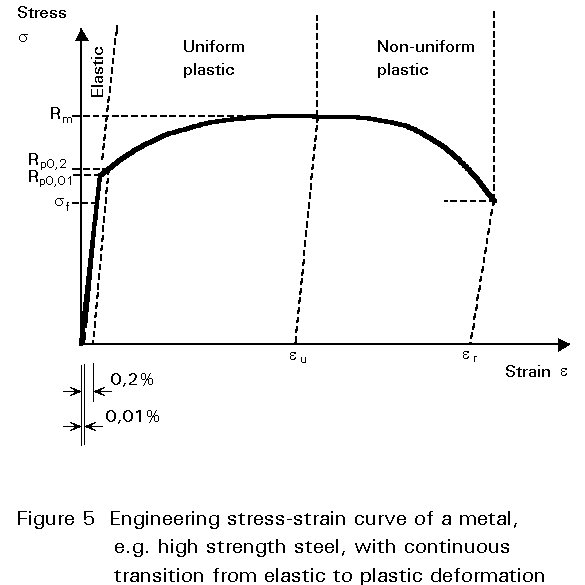
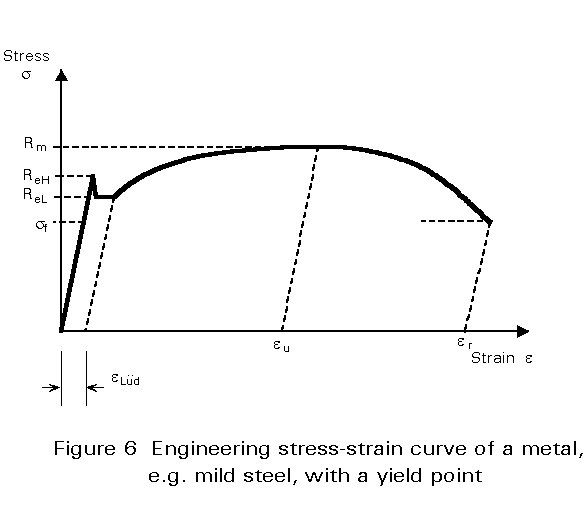
The engineering stress-strain curve can be divided into three regions: elastic deformation, uniform plastic elongation with continuously increasing stress (e £ eu) and non-uniform plastic elongation (e >eu).
In most metals there is a gradual transition from elastic to plastic behaviour and it is necessary to define a proof stress, usually Rp0,1 or Rp0,2 in order to characterise the onset of yielding. These are stresses at which a permanent elongation of 0,1 or 0,2% of the initial gauge length is obtained.
Some metals and especially mild steels show a discontinuity between the elastic and plastic regimes with a marked yield point followed by a short period of non-uniform plastic strain (Figure 6). This yielding phenomenon is described by:
The reason for this behaviour is that the dislocations are pinned by interstitially dissolved Carbon and/or Nitrogen atoms. These dislocations have to be unpinned by the upper yield stress. Once the dislocations are released they can continue to move at the lower yield stress. This process does not take place homogeneously over the whole specimen. Markings, known as Lüder's bands indicating plastically deformed regions, appear at 45° to the direction of loading and expand across the whole gauge length of the specimen.
In the range of uniform elongation, further plastic deformation is only possible by a continuously increasing load. The dislocation density grows with increasing deformation, making further deformation more difficult due to the interaction between the dislocations. This effect is referred to as strain or work hardening. The rate of strain hardening (ds/de) is high initially but decreases as plastic deformation increases.
In the third region of deformation the specimen continues to become narrower, but this now takes place locally resulting in the necking shown in Figure 7.
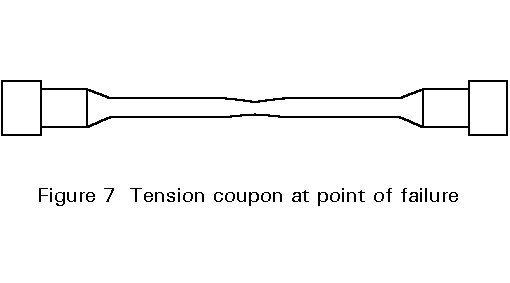
The stress at which necking begins is the ultimate tensile stress Rm=Fmax/So, the corresponding strain is the ultimate strain eu. Following the onset of necking, the load necessary to maintain elongation decreases although the local stress within the necking region continues to increase. Continued deformation leads to fracture, which is characterised by the fracture stress sf and the fracture strain er. The percentage reduction of area at fracture
Z = 100 (So - Su)/So
is a measure of the material's ductility, where Su is the minimum cross-section area at fracture in the necked region.
For the engineering stress-strain curve, both stress and stain are related to the initial specimen dimensions (So, Lo). Because the cross-section and length change continuously during deformation, these equations do not give a true indication of the stress and strain history. For a better description of the material properties, the change of the cross-section area must be taken into account. The true stress and the true strain are defined as follows:
s
t =where S is the instantaneous cross-section area.
e
t = for e £ eu.
(5)
Considering that plasticity takes place under conditions of constant volume, the relation between true and engineering stress and strain in the region of uniform elongation can be derived:
st = sn (1 + en) (6)
et = ln (1 + en) (7)
In the region of necking, the instantaneous cross-section of the specimen must be measured to obtain the true stress and the true strain. The true strain (Figure 8) is:
et = ![]() for 0 £ e £ er
(8)
for 0 £ e £ er
(8)
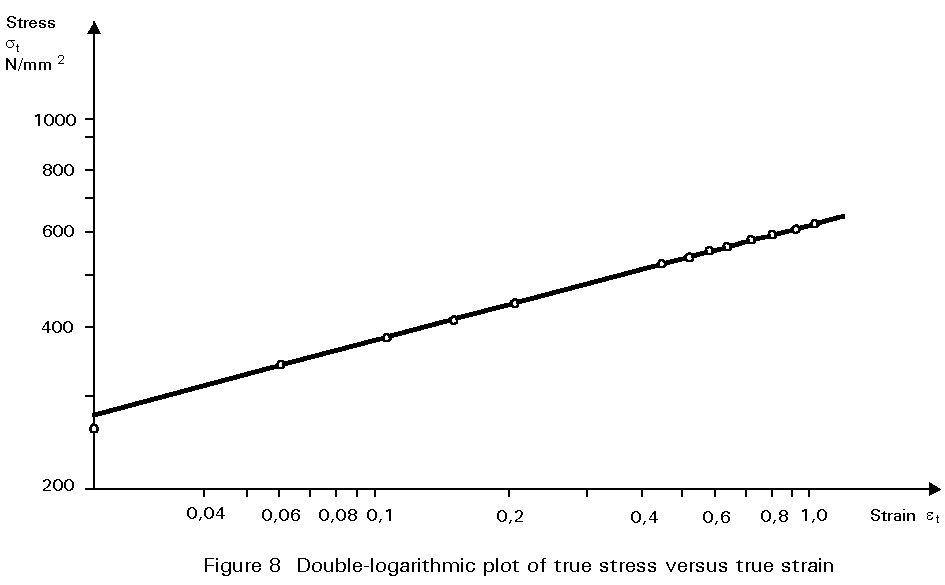
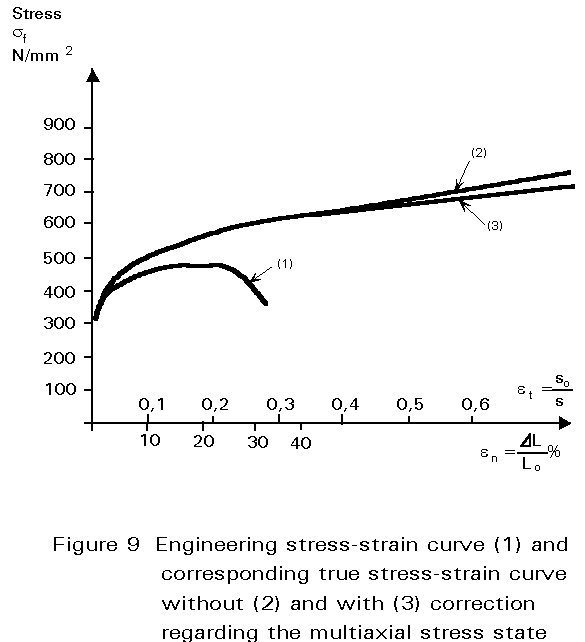
For the determination of the true stress, a correction factor km must be taken into account because of the multiaxial stress state resulting from necking.
Figure 9 shows the engineering stress-strain curve (1) and the corresponding true stress-true strain curve without (2) and with (3) consideration of the multiaxial stress state. Note that the true strain becomes much larger than the engineering strain due to necking and that strain hardening is always positive.
The previous section discussed the longitudinal response of a simple tensile specimen. If measurements of transverse strain (etrans) had also been taken it would have been found that the specimen became narrower as it extended. In the elastic region etrans = ue, where u, called Poisson's Ratio, has the value of about 0,3. This implies that the volume of the elastically deformed material is increasing because ![]() = e - 2etrans = 0,4e. In the plastic region, with much higher strains, the volume of material does not change significantly and etrans »
0,5e which implies that Poisson's ratio has a value of 0,5. This constant volume condition is most clearly illustrated in the necked region as rupture approaches. The locally higher longitudinal strains, are accompanied by high transverse strains giving the local necking.
= e - 2etrans = 0,4e. In the plastic region, with much higher strains, the volume of material does not change significantly and etrans »
0,5e which implies that Poisson's ratio has a value of 0,5. This constant volume condition is most clearly illustrated in the necked region as rupture approaches. The locally higher longitudinal strains, are accompanied by high transverse strains giving the local necking.
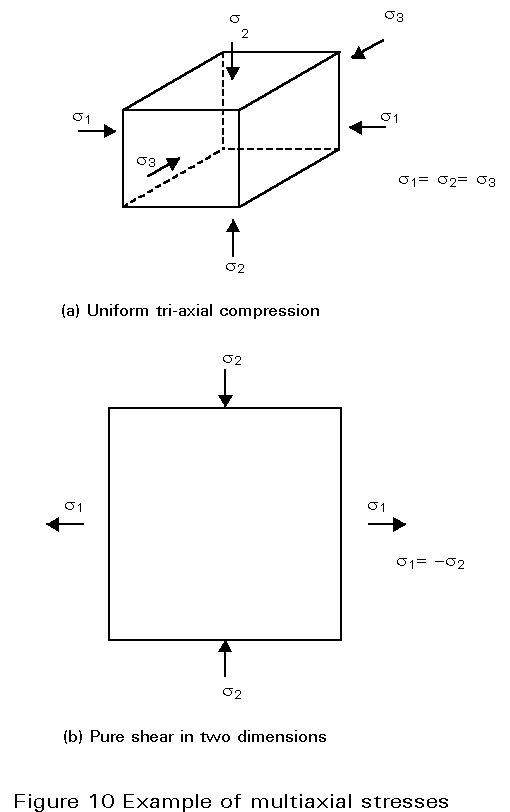
In many engineering situations stresses exist in more than one direction. Examples are shown in Figure 10. The direction and magnitude of these stresses influence the onset of yielding. In the balanced triaxial compression shown in Figure 10a, the material cannot yield because it has "nowhere to go" until there is a breakdown in the atomic structure of the crystals at several orders of magnitude of stress greater than the uniaxial yield stress. In the two-dimensional pure shear case of Figure 10b the tendency to expand in the x-direction from the tensile stress s1 is "encouraged" by the y-direction compression stress s2, and vice versa.
Different mathematical expressions have been developed to describe this interactive yield, and different formulations prove to be more accurate for different materials. Figure 11a illustrates the two most common criteria for metals under a two-dimensional stress state. The Hencky-von Mises expression which is usually used for steel and for three dimensional stresses, is given by:
s
y = (1/Ö2) {(s1 - s2)2 + (s2 - s3)2 + (s3 - s2)2}½where s1, s2 and s3 are the three principal stresses.
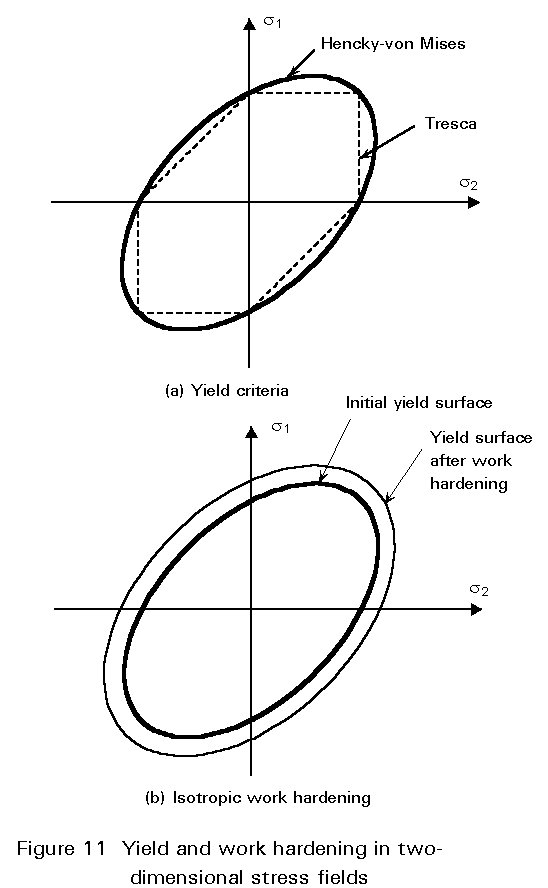
Figure 11b shows the most common model for work hardening in the presence of multi-axial stresses. In isotropic work hardening the yield surface expands uniformly, as shown.
Most engineering structures operate at ambient temperatures and are subject to loading rates that are sufficiently slow not to influence response significantly. However, elevated temperatures can be encountered in service (boiler plant) or by accident (fire). Impact and other accidental loading can lead to strain rates whose influence cannot be ignored.
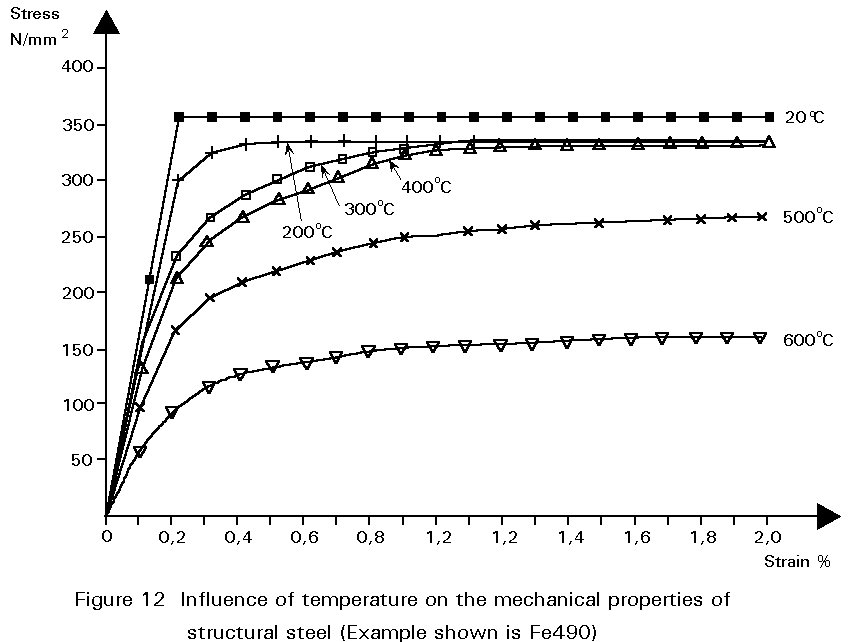
The movement of dislocations is facilitated by increasing temperature. Both yield and ultimate strengths are reduced as a result. In structural steels there is little loss of strength up to about 300°C. Thereafter there is a progressive loss of strength with increasing temperature. At 600°C the strength is typically 50% of that at ambient temperature.
Creep, i.e. increasing strain at constant stress, in structural steels can be discounted at ambient temperature. However at temperatures in excess of about 500°C creep deformation becomes significant. The influence of elevated temperatures on both stiffness and strength is illustrated in Figure 12.
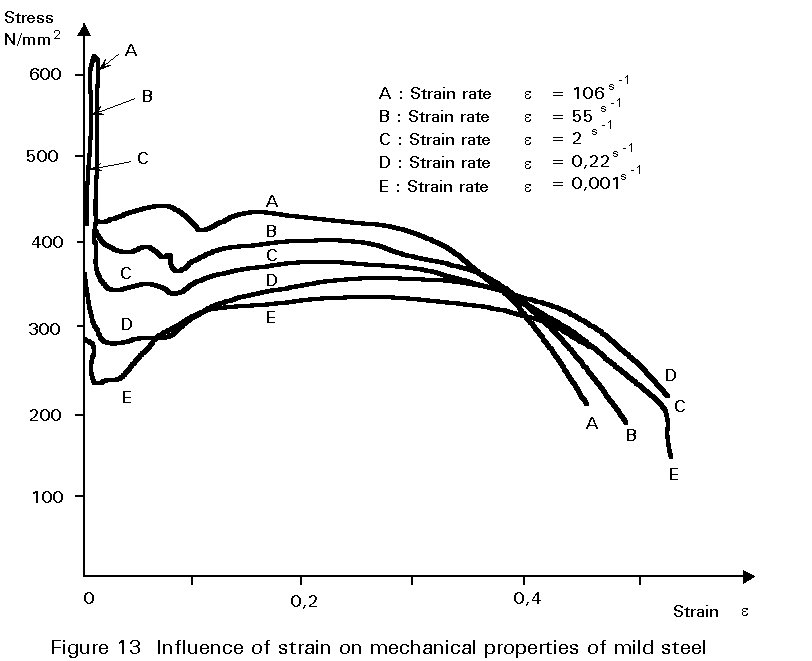
Dislocation movement is a time-dependent process. It is therefore understandable that high strain rates make yielding more difficult which is reflected in increased yield stress. The most widely accepted model for strain rate effects is the Cowper-Symonds expression given below. The significance of this effect on the tensile stress/strain behaviour is illustrated in Figure 13.
s/ss = 1 + {έ/D}1/q
where:
έ = strain rate
s
= dynamic yield stresss
s = static yield stress.D and q are dimensionless curve fitting coefficients.
D = 40.4 s-1 and
q = 5 for mild steel
The strength of a steel can be described as the resistance against the onset of plastic deformation under an external load. Plastic deformation occurs by the movement of dislocations through the metal lattice which enables single lattice planes to slip consecutively over one another. If this motion is hindered by lattice defects, a higher external load must be applied so that the dislocations can overcome the obstacles. It is for this reason that means of increasing the strength of steels always aim at hindering dislocation movement. Obstacles to dislocation motion can be classified according to Table 1.
TABLE 1
|
Dimension |
Generator |
Mechanism |
|
0 (point) |
solute atoms |
solid solution hardening |
|
1 (linear) |
dislocations |
strain hardening |
|
2 (plane) |
grain boundaries |
grain refinement |
|
3 (spatial) |
particles |
precipitation/dispersion hardening |
|
Strengthening of Steels |
||
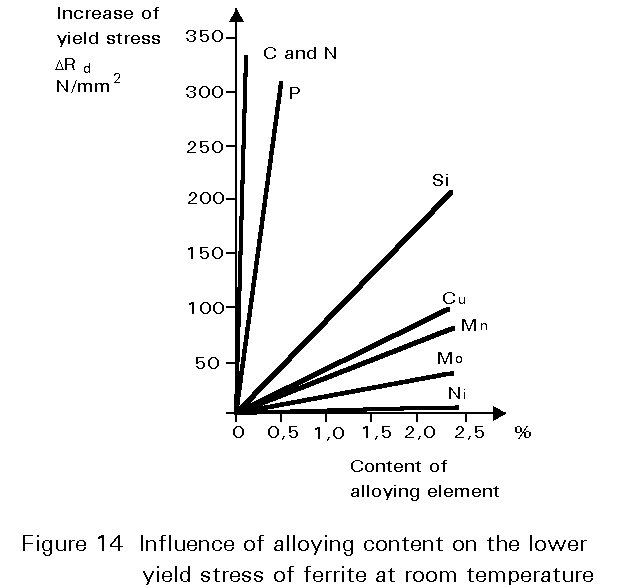
The increase of strength is produced by foreign atoms which are dissolved in the metal matrix. Since foreign atoms differ in size, physical and electrical properties compared to the metal matrix, they cause a lattice distortion that hinders the movement of dislocations. The increase of yield stress depends on the kind, amount and distribution of the foreign atoms, Figure 14. It can be seen that the increase of strength caused by C and N is especially high. This is due to the fact that these atoms dissolve interstitially between the atoms of the matrix, which results in a high lattice distortion. The other elements shown in Figure 14 dissolve substitutionally and occupy regular lattice positions producing less distortion.
Increasing strength by solid solution hardening leads to a decrease in toughness. (Toughness is the ability of a material to avoid brittle fracture - see Lecture 2.3.2.) Therefore, the potential level of strength attainable by solid solution hardening is usually not sought because of the possibility of brittle fracture.
Linear lattice defects are the dislocations themselves. The lattice distortion surrounding the dislocation disturbs the movement of other dislocations. This interaction increases with increasing dislocation density.
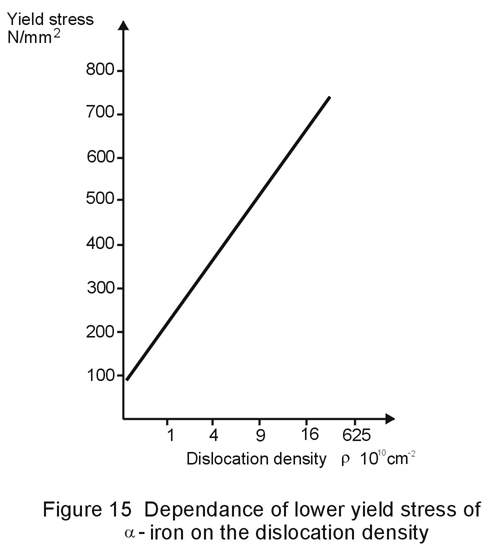
When cold forming steel, e.g. cold rolling, dislocations must continuously be produced because they permanently block each other. The dislocation density rises and increases the strength of the steel by strain hardening (Figure 15). Such hardening is accompanied by a pronounced reduction in toughness.
Grain refinement is the most important strengthening mechanism in structural steels because it is the only method of strengthening which is accompanied by an increase in resistance to brittle fracture.
The grain boundaries are barriers to dislocation motion. Consequently as the grain size is decreased, the number of barriers increases and this is reflected in increased yield strength. The effect of grain size on yield stress is described by the Hall-Petch equation:
ReL = siy + ky . d-1/2
where
ReL is the minimum yield strength
siy is the friction stress; the stress at which yielding begins in a material with very large grains
ky is the grain boundary resistance
d is the mean grain diameter.
When a moving dislocation encounters a particle it can pass by only two mechanisms:
× cutting through the particle, or
× bowing between and around particles, leaving a section of the dislocation as a ring around the particle.
In steels, the dominant particle hardening mechanism is dislocation bowing. Strength is then inversely related to the interparticle spacing. Consequently strength increases as the particle size decreases and as the volume fraction of precipitates increases.
Strengthening particles are obtained most usually by the precipitation process in the matrix during heat treatment. In steel this is most familiar during tempering of quench hardened medium carbon steels, but it also occurs in structural steels during cooling after controlled rolling or during subsequent tempering treatments.
"Hardness" is a measure of resistance to deformation when a loaded indenter is forced to penetrate the surface of the metal under test. The penetration of the indenter into the specimen leads to a local deformation which is both elastic and plastic.
Testing methods can be either static or dynamic. Both elastic and plastic deformation are considered for the evaluation of dynamic hardness, expressed in terms of the absorbed energy. Dynamic testing methods include impact hardness testing and Shore hardness testing. Their advantage lies in the possibility of quick testing which can be performed at any location. Compared to static hardness testing methods, the dynamic methods are less precise.
The common static testing methods of indentation hardness differ in the type of indenter forced into the metal. The Brinell test uses a hardened steel ball (EN 3), the Vickers test (EN 5) a square-based diamond pyramid (included angle = 136°), and the Rockwell test (EN 10004) is performed with a diamond cone indenter (included angle = 120°).
The indenter is slowly (almost statically) pressed into the specimen. After removing the load, the size of the indentation is measured. Compared to dynamic testing, only the plastic deformation is taken into account. Static testing methods are favoured in industry and research because of the consistency of test results.
The different hardness measurements correlate quite closely, especially at lower values. The correlation of hardness values with other measures of resistance to deformation, such as tensile properties, is more complicated but a useful engineering rule of thumb is that the tensile strength in units of Nmm-2 is approximately 3 times the Vickers hardness.
× Young's modulus.
× Poisson's ratio.
× Yield stress, or proof stress for metals without a defined yield point.
× Ultimate strength.
× Hardness.
× temperature.
× strain rate.
× multi-axiality.
× geometry.
× alloying content.
× level of impurities.
× physical treatment.
APPENDIX 1
Typical mechanical property data for weldable structural steels
|
Steel (Grade according to EN10025) |
Condition |
Yield Stress (N/mm2) |
Ultimate Tensile Strength (N/mm2) |
% Elongation to Fracture (Lo = 5,65ÖSo) |
|
Grade Fe430B (0,25% carbon) |
hot-rolled |
275 |
470 |
22 |
|
Grade Fe430D (0,19% carbon) |
normalised |
275 |
470 |
22 |
|
Grade Fe510B (0,23% carbon) |
hot-rolled |
355 |
550 |
20 |
|
Grade Fe510D (0,18% carbon, 0,10% vanadium) |
normalised |
355 |
550 |
20 |
Typical mechanical property data for some common non-ferrous metals and alloys
|
Metal or alloy |
0,2% Proof Stress (N/mm2) |
Ultimate Tensile Strength (N/mm2) |
% Elongation to fracture (Lo - 5,65ÖSo) |
|
Aluminium (annealed) |
34 |
77 |
47 |
|
Aluminium (cold worked) |
94 |
115 |
13 |
|
Duralumin (annealed) |
123 |
231 |
15 |
|
Duralumin (age-hardened) |
278 |
432 |
15 |
|
Cooper (annealed) |
54 |
223 |
56 |
|
Copper (cold worked) |
285 |
316 |
13 |
|
70-30 brass (annealed) |
85 |
320 |
65 |
|
70-30 brass (cold worked) |
378 |
463 |
20 |
Typical values of Young's modulus for metals
|
Metal |
Al |
Au |
Ti |
Cu |
Fe |
Ni |
|
kN/mm2 |
70 |
79 |
120 |
130 |
210 |
200 |